
Designing Annual Reports That Investors Actually Read: Key Trends for 2026
Annual reports remain vital tools for companies seeking to build trust, attract investment, and demonstrate performance. But as investor expectations rise, annual report design must evolve. In 2026, what makes a report one that investors not only receive but truly read?
Here are key trends and best practices for designing annual reports that engage, inform, and impress.
Why Annual Report Design Matters?
- First impressions count. Investors often flip straight through to visual charts, infographics, and executive summaries before reading dense financials. A strong design invites them in.
- Clarity promotes trust. Clean layouts and legible typography reduce friction. When numbers, metrics, and narratives are easy to follow, credibility rises.
- Brand alignment boosts recognition. Reports must reflect the company brand colour palette, image style, and tone, so stakeholders see consistency across all touchpoints.
Key Annual Report Design Trends for 2026
1. Integrated Print and Digital Experiences
As more investors access materials online:
- High-quality print versions still matter, especially for board members, regulators, or those who prefer hard copy.
- Digital reports and microsites offer interactivity: clickable content, embedded visualisations, and video messages.
- Seamless coordination between print and digital versions ensures a consistent design, content hierarchy, and branding.
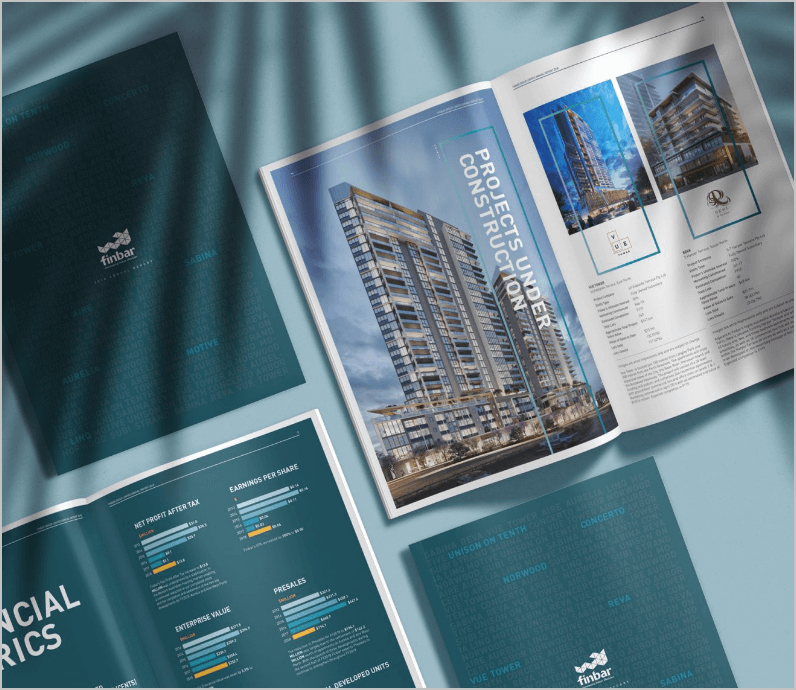
We designed Fleetwood Australia’s annual report to match the organisation’s evolving direction. The refined visuals, modern layouts, and improved presentation of key data helped strengthen the clarity and impact of their performance story.

2. Data Visualisation & Infographics over Dense Tables
Investors want insights, not just raw data.
- Use infographics, charts, and graphs that highlight trends (growth, margins, returns).
- Combine visuals with short explanatory text (call-outs) to avoid ambiguity.
- Emphasise readability: limit colours per chart, ensure contrast, and label axes clearly.
3. Narrative-Driven Structure with Clear Signposting
Structure helps readers find what matters.
- Start with an executive summary or “at a glance” section: key metrics, achievements, and challenges.
- Use section headers and subheaders that correspond to investor priorities: performance, governance, sustainability, and outlook.
- Embed “Key Takeaways” or “What This Means for Investors” sections within major chapters.
4. Sustainability & ESG Disclosures with Design Attention
Environmental, Social, and Governance (ESG) content is not optional anymore.
- Reports need dedicated ESG sections with visuals (e.g., carbon footprint graphs, social impact case studies).
- Clear compliance with global reporting standards (e.g., GRI, SASB) but without overwhelming technical jargon.
- Use photography, imagery, or case stories to humanise impact.
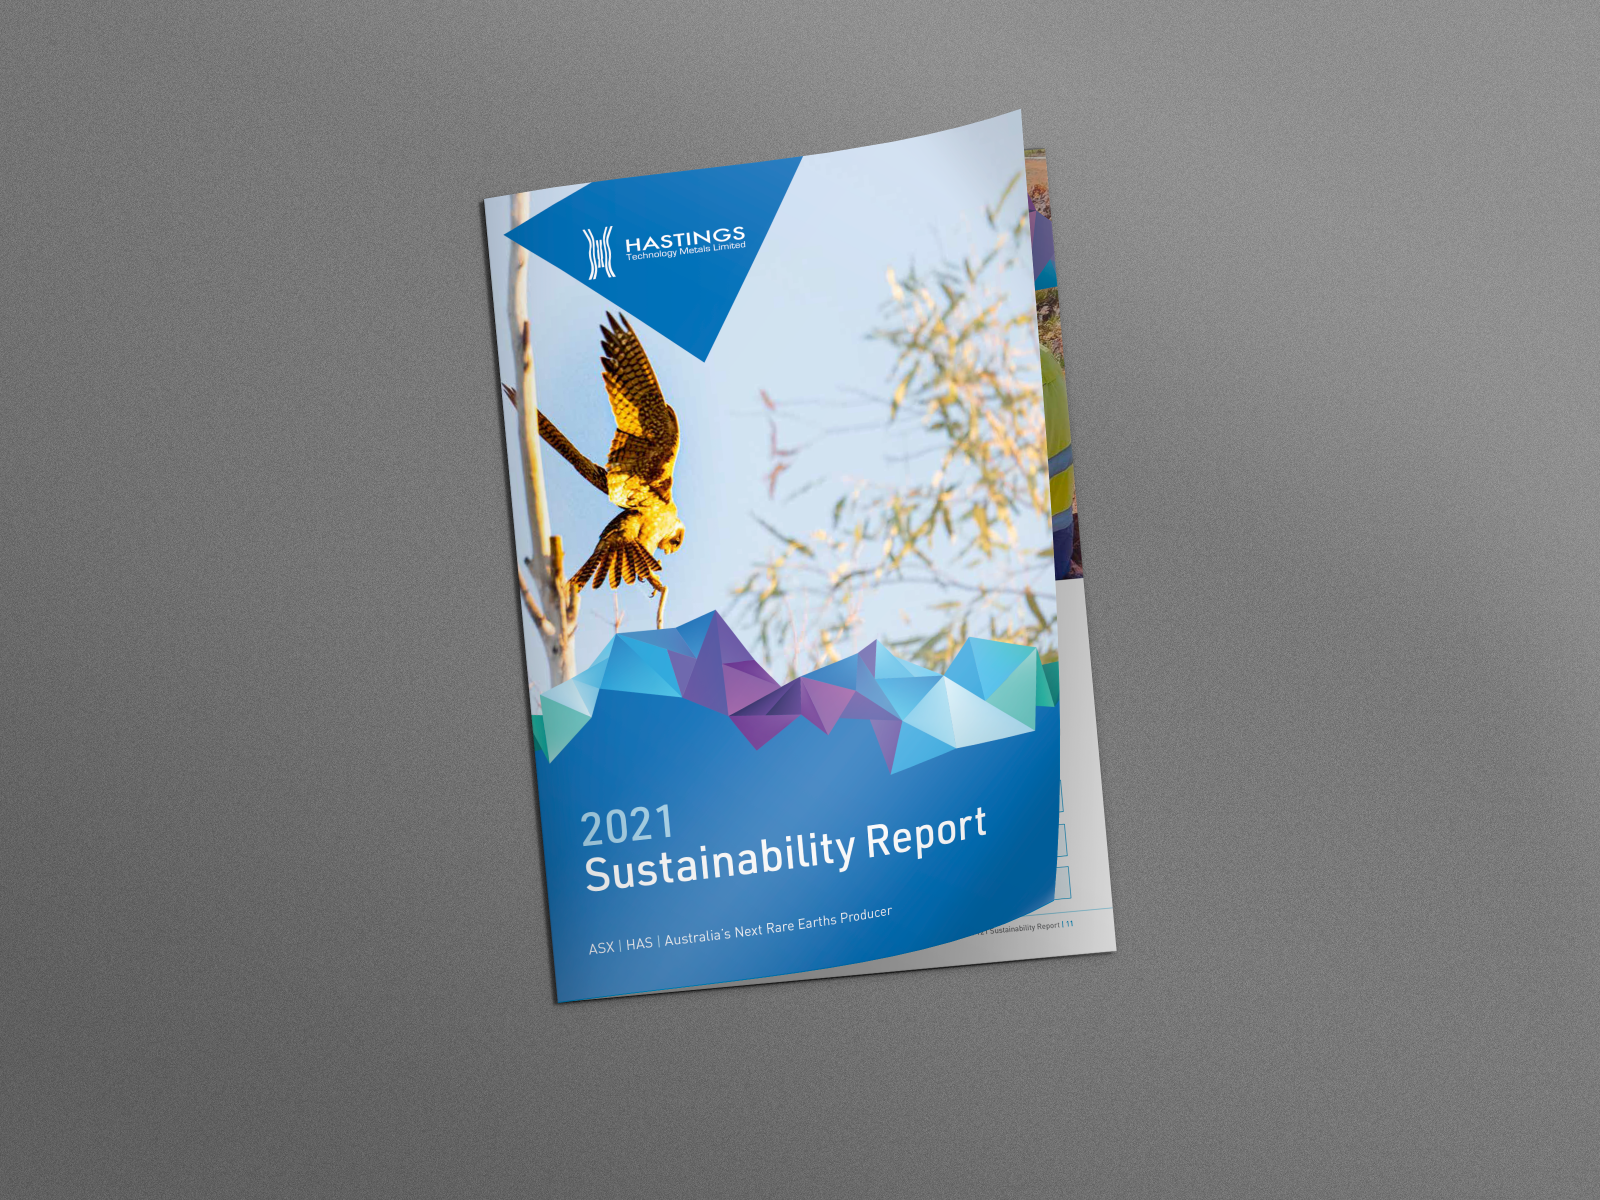
During the Hastings – Sustainability Report project, we visualised emissions data through clean circular charts that clearly showed year-on-year reductions. This made the environmental performance easy to understand at a glance, even for readers without a technical background.
5. Accessibility, Legibility & Inclusive Design
To reach diverse stakeholders, reports must be accessible.
- Fonts: use sizes and typefaces that are legible; avoid overly decorative fonts.
- Colour contrast: Ensure charts and text meet accessibility contrast ratios.
- Alt text and screen-reader-friendly PDF/digital documents.
- Ensure the layout works well on mobile/tablet devices.
6. Brand Voice & Visual Consistency
Visual coherence ensures trust and recognisability.
- Maintain brand typography, colour palette, and logo usage throughout.
- Image style consistent: whether photography, illustrations, or icons.
- Ensure consistency between the cover, internal spreads, infographics, and structural elements.
Key Components to Include in Annual Reports
Here are what investors expect and how the annual report design can make each component stand out:
| Component | Good Design Practice |
| Executive Summary / Highlights | Use bold headings, icons, pull quotes, and milestone graphics to summarise fast. |
| Financial Tables & Statements | Prefer simplified visuals; allow for downloadable, detailed data to be presented separately; utilise white space to reduce clutter. |
| Governance & Risk Section | Include diagrams or infographics showing governance structure or risk matrices. |
| Sustainability / ESG | Use charts for metrics and photo essays or case snapshots for human stories. |
| Outlook / Strategy | Visual roadmaps, future-focused graphics, and call-outs for planned initiatives. |
Design Process & Stakeholder Engagement
To deliver a report investors will read, design cannot be an afterthought, but part of a strategic process:
- Early briefing with key stakeholders – finance, investor relations, marketing, and sustainability. Understand what issues must be highlighted.
- Mood boards and drafts – test styles, colour palettes, and infographics. Get feedback early to avoid costly redesigns.
- Proofing & compliance checks – design must align with legal, regulatory, and disclosure obligations.
- Production & digital optimisation – ensure print and digital files are high quality; test digital for responsive layouts and download speed.
Trends to Watch Going Forward
- Use of micro-animations or motion graphics in digital reports to draw attention to metrics.
- Increased emphasis on live data feeds (e.g., up-to-date financial dashboards embedded in microsites).
- Personalised investor access: custom report modules for different stakeholder groups.
Ready to create an annual report investors won’t skip?
Designing an annual report that investors actually read requires more than compiling financial data—it takes a thoughtful balance of strategy, design, and storytelling. At Blackbox design, every annual report is approached as a brand communication piece, not just a compliance requirement. Our focus is on creating layouts that draw readers in, visuals that clarify complex information, and narratives that reflect your business performance with confidence and transparency.
Related Articles
-
From Compliance to Communication: Why Annual Report Design Matters More Than Ever?
For many years, annual reports were seen only as a legal requirement, a thick document full of numbers, tables, and technical notes. But things have changed. Today, an annual report ...
More -
What’s Included in an Annual Report Design?
Annual reports are documents that present important corporate information. You probably know that every business, including the public sector, non-profits, and nowadays even small businesses, send their annual reports to ...
More -
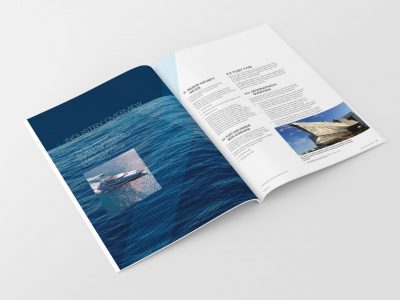
Creating Compelling & Powerful Annual Report Design Strategies
An annual report design means it is time to reflect on the past year’s financial and other activities and plan for future goals. It is the time to show ...
More -
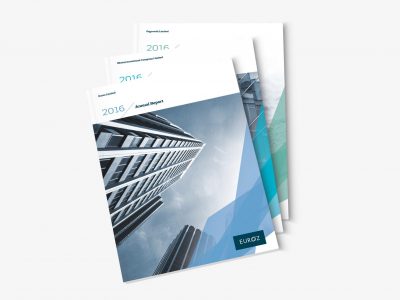
The Latest Trends in Annual Report Designs
Annual reports are vital to your business as it tells your story, celebrates your successes, and connects and strengthen your relationship with your important audience. To keep them engaging, you ...
More