Benefits of a Digital Annual Report
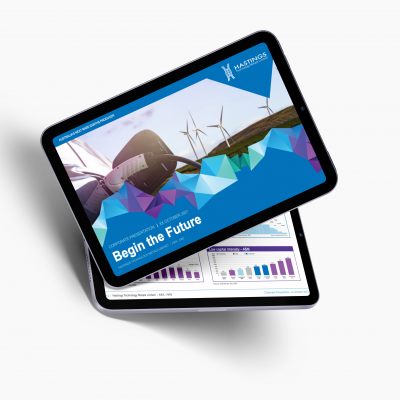
Digital & Microsite Annual Reports

These reports also play a massive role in impressing new stakeholders and potential investors. Though annual reports are still widely used and accepted as printed forms, they are not quickly available to everyone. Perhaps, let’s say businesses don’t hit a wider reach.
Benfits of Digital and Microsite Annual Reports
- Digital and Microsite annual reports are cost-effective as printed annual reports typically cost a little higher than digital copies. Moreover, you get the benefit of zero printing costs and save a lot of time.
- Microsite annual reports are logical and easy to read and process. They are also concise and have a stunning visual appeal that tells a story in no time. Moreover, they are rich in features like you can go for interactive comparisons of critical data that provide an easy explanation to your audience.
- Digital annual reports are highly engaging and captivating. Since there is no limitation when it comes to using effective infographics and even animation on microsite annual reports, it makes it easier to convey your brand’s statistical figures and other information effectively.
- Digital and Microsite annual reports are easy to share. It also allows your shareholders to share your annual report on their social media or other web portals, helping you get a wider reach. Hence, it can bring more attention and funds, especially to non-profits.
- They are a smart communication tool as they are easy to access by anyone at any time. Given the number of online users, having a microsite annual report will help your business reach a wide array of audiences.
Can Annual Reports Actually Be A Part Of Your Corporate Website?

Yes! Annual reports can be a part of your website. By using microsites, you are enabling search engines to get you to your potential audience quickly and efficiently.
So, to reach a wider audience, annual reports must be readily available and accessible. The best way to do this is by going digital, and digital annual reports are available as PDFs for shareholders, analysts, and journalists to download. However, that’s not enough. How about publishing your yearly report on your website? That hits right, doesn’t it? It’s no wonder why savvy marketers have already started using microsite annual reports. Digital and microsite annual reports are highly interactive and communicate even better than the traditional printed annual reports.
What Is a Microsite Annual Report?
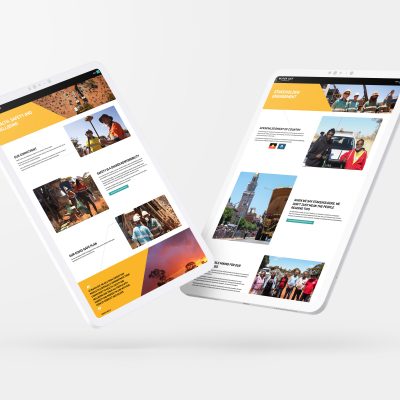
To begin with, let’s see what a microsite is. A microsite, also called a mini website, is a page on the website utilised for promotions. Technically, microsites act as separate entity for the business by using a different domain or subdomain than the main website.
So, coming back to microsite annual reports, they are one-page annual reports (website) with captivating visual content and easy navigation. They serve the way for the future as they offer a more efficient and meaningful communication opportunity for businesses.
We excel in creating interactive data visualisations and infographic-rich annual reports. We can also work on your existing yearly report to create a stunning digital annual report for your website. If you are ready for the change, contact us.
Annual Report Design Inspiration For 2024

Annual reports are more than financial reports. They have become more comprehensive, and everything from the purpose, content and style has evolved. Now annual reports are meaningful communication tools for marketing that gives valuable insights into the culture, vision, and success of a brand.
Stunning and meaningful annual report designs have the potential to entice a wide range of audiences and bring new investors. So, you must pay great attention to creating your annual report, and our designers are the experts in annual report designs in Perth and Melbourne. Do you want to know how we do it for our clients? Here are some of our annual report design inspirations.
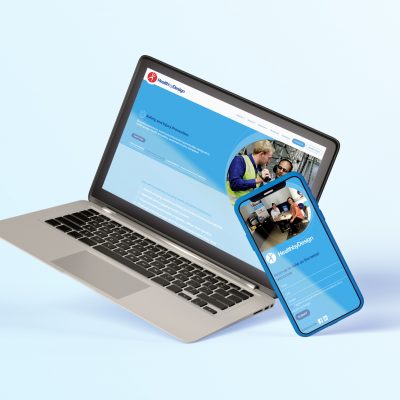
1. Never Ignore Infographics

With infographics, you can make your statistics into engaging visuals that tell a compelling success story and increase readership. Using infographics is an interactive way to represent your statistics, making them look simple, attractive, and easy to understand.
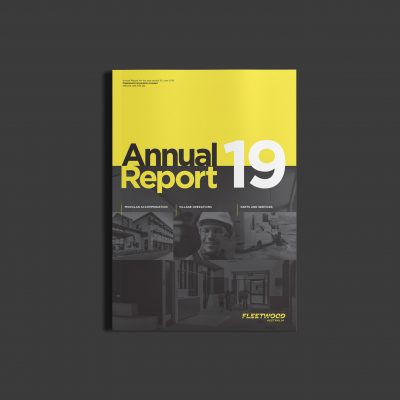
Infographics not only carry out the purpose well by engaging and delivering the figures but become an outstanding marketing highlight. Businesses, especially non-profits, must utilise infographics in their annual report designs for stable business growth. For instance, go through our 2019 annual report we designed for Fleetwood, which features stunning infographics detailing its growth.
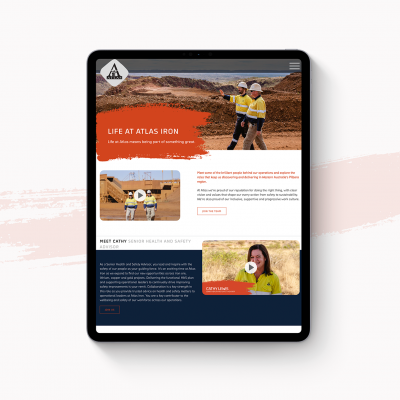
2. Use Bold Colours

Leverage Colours Palettes and typeface from your brand style guide to add richness to annual reports. Enhance user’s experience, using colours that closely represent your brand emotion.
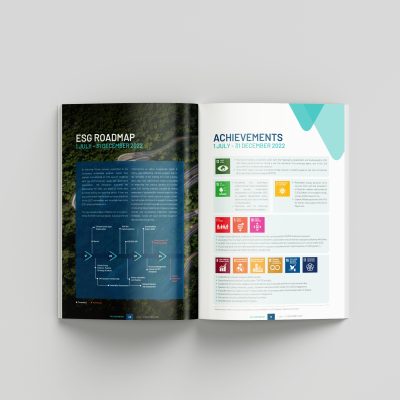
For instance, showing an important segment in bold colour and jumping to a lighter colour on the next page creates a beautiful contrast and makes the content more readable. See Talon Energy’s 2021 annual report design that features bold and light colours on consecutive pages, perfectly reflecting its brand emotion.
3. Make Your People Count

Every picture has a story
Like infographics and colours, including images of your people – your employees, management team, customers, clients, or the CEO, add significant depth and detail to your annual report. It evokes emotion as people respond to other people. It makes your annual report design more interesting and intriguing. Adding people also makes it easy for you to showcase your brand culture and story in a more sophisticated way.
Alternatively, you can also add pictures of your inventory or warehouse. For instance, Cash Converters’ 2019 annual report includes the Chairman’s picture, which carries substantial weight to the report.
4. Be Consistent With Design

Finally, consistency is the key. Keep your infographics and other visual elements, including layout, colour, and typography, in such a way that each design element compliments the other one without conflict. Making effective use of white space also helps make the report more digestible.
Key Takeaways
- Annual reports are important marketing collateral, so never compromise on the design aspect.
- Use compelling infographics to showcase your statistics and data. They are the perfect way to tell your story.
- Go for bold colour palettes to make your annual reports refreshing and unique. Contrasting colours help highlight and break down information.
- Include the people of your organisation to add real value to your brand story.
- Keep the design consistent.
With more than 15 years of expertise in creating beautiful and meaningful annual report designs to help brands make a difference and attract new investors, Blackbox Design is here to help you. Need annual report design in Perth and Melbourne? Contact our team.